Most Companies Aren't Data-Driven. They Just Own a Lot of Data.
Every company says they're data-driven. Most of them are insincere not maliciously, but because they confuse buying tools with changing behaviour.
I lead an analytics department at a multi-subsidiary company in Nigeria. My work spans marketing performance dashboards, customer retention analysis, social media analytics, and cross-subsidiary data strategy. Before this, I worked remotely as a data analyst for an international analytics firm. I hold a B.Tech in Applied Mathematics, and I run an EdTech initiative that trains young people across Africa in data analytics, coding, and robotics.
I say all of that not to list credentials, but to make a point: I’ve spent years inside the exact organisations that struggle with this problem. I’ve inherited data environments held together by duct tape and good intentions. I’ve built analytics functions from scratch in companies where “data strategy” previously meant someone copying numbers into a slide deck the night before a board meeting. I’ve watched significant tool investments gather dust because nobody addressed the culture underneath.
The gap between having data and being driven by data is enormous. And after leading analytics teams through that gap, I can tell you — it has almost nothing to do with technology.
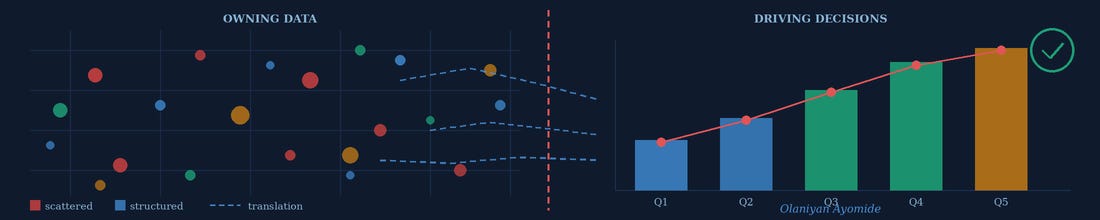
The Tool Trap
There’s a seductive lie in our industry: that the right tool will make you data-driven.
Buy Power BI. Set up a warehouse. Connect your CRM. Deploy a fancy ETL pipeline. Done. you’re data-driven now, right?
Wrong.
Here’s what I’ve seen repeatedly: an organisation invests in a BI platform, the data team builds beautiful dashboards, and within three months those dashboards have single-digit daily views. Meanwhile, the marketing team is still exporting CSVs into Excel and emailing them around every Monday morning. The tool exists. Nobody trusts it. Nobody was trained on it. Nobody’s incentivised to use it. Decisions continue to be made in WhatsApp group chats and hallway conversations.
When I stepped into my current role, I faced exactly this. We had data flowing from multiple subsidiaries, but no shared definitions, no centralised reporting layer, and no consistent framework for how different business units should interpret the same metrics. My first instinct was to build dashboards. My better instinct — the one that actually worked — was to spend the first three weeks in rooms with each business unit’s leadership, aligning on what we were measuring and why, before touching a single visualisation.
That decision taught me something I now treat as a first principle: the tool is never the bottleneck. The culture is.
The Five Stages of Data Maturity (And How to Diagnose Where You Are)
Through my work across multiple organisations, I’ve observed that companies tend to fall into one of five stages. Understanding where you are is the prerequisite to getting where you need to be and most organisations are far earlier in this journey than they think.
Stage 1: The Patchwork
There’s no dedicated data team. Every department pulls numbers from different sources, builds one-off spreadsheets, and presents conflicting figures in the same boardroom meeting. Analytics is a side job someone inherited because they were “good with Excel.” Leadership leans heavily on instinct because no one has given them a reason to lean on anything else.
The diagnostic: Two departments present the same KPI in a leadership meeting and the numbers don’t match. Nobody can explain why. Nobody is even surprised.
Stage 2: The Departmental Silo
You’ve hired an analyst or two, maybe attached to marketing or finance. They’re doing decent work, but they operate in isolation. Marketing has one version of the numbers. Finance has another. The CEO gets two reports that tell different stories about the same quarter. There’s no single source of truth — just multiple competing versions of a fractured one.
The diagnostic: Your analysts spend more time reconciling numbers between departments than generating insights. Cross-functional meetings begin with 15 minutes of arguing about whose spreadsheet is correct.
Stage 3: The Centralised Function
The company invests in a centralised data team, a shared warehouse, and agreed-upon definitions for key metrics. When someone says “revenue,” everyone means the same thing. When someone asks about customer churn, there’s one number — not three.
This is where real trust in data begins. But it’s also where most companies stall, because centralisation creates a new problem: the data team becomes a bottleneck. Every question flows through the same overloaded analysts. Business teams wait days or weeks for answers to questions that should take minutes.
The diagnostic: Your data team has a request backlog that’s weeks long. Business teams have started building workaround spreadsheets because they can’t wait for “the official numbers.” You’ve solved the trust problem but created a speed problem.
Stage 4: The Self-Serve Organisation
The data team shifts from answering every question to building systems that let others answer their own questions. Governed datasets. Standardised metrics layers. Drag-and-drop reporting layered on top of clean, trusted data.
The analyst’s job evolves from report-puller to architect — designing the data infrastructure that makes everyone else effective with data, while maintaining quality and governance from behind the scenes.
The diagnostic: Business users can build their own reports from pre-approved datasets without filing a request ticket. The data team’s backlog has shifted from “pull me this number” requests to strategic projects.
Stage 5: The Truly Data-Driven Culture
Data informs strategy at every level. Not just the C-suite reviewing quarterly dashboards, but the social media manager testing content variations based on engagement patterns, the sales lead adjusting territory plans mid-quarter based on pipeline data, the product manager killing a feature based on usage metrics rather than opinion. Data literacy is a company-wide competency, not a department-specific skill.
The diagnostic: In any given meeting, someone references a metric before stating an opinion and nobody finds that unusual. Experimentation is routine, not exceptional.
Most companies I’ve worked with in Africa are somewhere between Stage 1 and Stage 2. The ones that break through to Stage 3 and beyond share a few things in common and none of those things are about which BI tool they picked.
Five Principles That Actually Build a Data-Driven Organisation
After leading analytics across multiple business units and subsidiaries, I’ve distilled what separates data-driven organisations from data-theatrical ones into five principles. I use these as a working framework when assessing any new data environment — whether I’m stepping into a new role, advising a leadership team, or diagnosing why a company’s analytics investment isn’t delivering returns.
1. Leadership Must Ask for Data Before Opinions
This is the single biggest differentiator. When a CEO walks into a strategy meeting and the first question is “what does the data say?” rather than “what do we think?” that signal cascades through the entire organisation. People start preparing data because they know it will be asked for. The culture shifts top-down, not bottom-up.
In practice: I restructured our marketing performance reviews around a standard dashboard that loads before anyone speaks. The discussion starts with what the numbers show, then moves to interpretation and strategy. Before this change, the same meetings ran on anecdotes and whoever spoke with the most confidence. The data didn’t change — the ritual around it did. And that changed everything.
2. Shared Definitions Are the Foundation, Not a Nice-to-Have
If your marketing team counts a “customer” differently than your finance team, you’re not data-driven. You’re just arguing with numbers. Data governance isn’t glamorous work, but without it, every dashboard you build is decoration.
In practice: One of my first cross-subsidiary projects was building a shared metrics dictionary — a single reference document that defines every key metric, specifies the calculation logic, identifies the source system, and names the accountable owner. When I started, the same metric was being calculated three different ways across three business units. After alignment, leadership could trust the numbers for the first time. It took weeks of meetings. It was the most important work I did that year.
3. The Analyst’s Job Is Translation, Not Calculation
The most valuable thing I do isn’t writing DAX measures or building Power BI reports. It’s sitting in a room with non-technical stakeholders and turning a vague business question into a structured analytical problem then translating the answer back into a decision they can act on.
In practice: A business unit lead once asked me, “Is our social media working?” That question, as stated, is unanswerable. My job was to reframe it: Which content formats are driving the highest engagement-to-conversion ratio among our target segments, and how does that compare to our paid acquisition cost per conversion? That reframing turned a vague worry into a measurable investigation that directly informed the team’s content budget allocation for the following quarter. The technical work was straightforward. The translation was the hard part — and the part that created value.
4. Self-Serve Analytics Requires Architecture, Not Just Access
Self-serve doesn’t mean giving everyone raw database access and hoping for the best. It means building governed datasets and reporting layers that let business users explore data confidently without breaking anything or drawing wrong conclusions from malformed queries.
In practice: I build Power BI datasets with row-level security, pre-calculated measures, and clear naming conventions so that a marketing manager can slice performance data by campaign, channel, or time period without ever writing a formula — and without seeing data from business units they shouldn’t access. The analyst’s role becomes quality control and infrastructure. The manual report generation that used to consume 60% of my team’s time drops to near zero, freeing capacity for the strategic work that actually moves the business.
5. You Must Tolerate Being Wrong
Data-driven doesn’t mean data-perfect. It means you’re willing to test hypotheses, measure outcomes honestly, and change course when the numbers contradict your assumptions. Companies that punish failure don’t become data-driven. They become data-theatrical — collecting numbers to justify decisions that were already made.
In practice: I ran a retention analysis where the initial hypothesis from the business team was that customers were churning because of pricing. The data told a different story entirely — churn was heavily concentrated in a specific onboarding cohort with low early engagement, regardless of price tier. The team had to scrap their planned discount campaign and invest in onboarding improvements instead. It was uncomfortable. It was also the right call. That willingness to let data override assumption is the real test of whether a company is data-driven or just data-decorated.
The African Context: Why the Playbook Looks Different Here
I want to be direct about something: building a data-driven culture in Africa comes with structural challenges that Western-centric strategy guides don’t account for. Acknowledging these isn’t pessimism. it’s the prerequisite for building realistic solutions.
Cost structures work against you. Cloud warehousing, BI licenses, API integrations these are priced in dollars for organisations operating in local currencies with volatile exchange rates. I’ve watched companies make brilliant adaptations: leaning into Python and Google Colab for analysis, using open-source orchestration tools, and building modular data pipelines that deliver enterprise-grade logic without enterprise-grade costs. My own approach has been to architect pipelines using Python and pandas with a modular structure that separates data collection, cleaning, and analytics into distinct layers — each layer independently testable and maintainable. You don’t need a six-figure Snowflake contract to think like a senior data engineer.
The talent pipeline is thin and unevenly distributed. There are exceptional analysts across the continent, but they’re concentrated in a few cities. Building a data team in Abuja is a fundamentally different proposition than building one in Lagos, London, or San Francisco. This reality is part of why I founded an EdTech initiative that trains young people in data analytics, coding, and robotics because the pipeline of data-literate talent needs to widen dramatically if African companies are going to compete on analytical capability.
Seniority culture creates real friction. In many African business environments, experience and seniority carry enormous weight in decision-making. Suggesting that a junior analyst’s dashboard should inform a veteran director’s strategy requires a specific kind of organisational trust. The way I’ve navigated this isn’t by positioning data against experience. I frame analytics as a way to amplify experienced judgment — giving senior leaders better information to apply their deep expertise to, rather than replacing that expertise. This reframe matters. It’s the difference between the data team being seen as a threat and being seen as a strategic partner.
None of these challenges are insurmountable. But they mean the path to data maturity in Africa is necessarily more pragmatic, more resource-conscious, and often more creative than what you’ll find in most published playbooks. That creativity, in my experience, is actually a competitive advantage. it forces you to build lean, intentional systems rather than bloated ones.
A 12-Week Jumpstart: Where to Begin
If you’re recognising your own organisation in Stages 1 or 2, here’s the sequence I recommend. I’ve tested this progression across multiple environments, and the order matters — each step creates the foundation for the next.
Weeks 1–2: Identify your three highest-impact questions. Not thirty. Three. What are the business questions that, if answered well with data, would change how leadership operates? Maybe it’s “which customer segment has the highest lifetime value?” or “which marketing channel actually drives revenue, not just clicks?” Build your first data capability around those specific questions. Everything else is scope creep — and scope creep is the number one reason analytics initiatives die early.
Weeks 3–4: Build a metrics dictionary. Select your 10 most critical metrics. Define each one precisely: what it measures, how it’s calculated, where the source data lives, who owns the definition, and how often it updates. Get every department head to sign off. This single act of alignment does more for data culture than any tool purchase ever will.
Weeks 5–8: Create one reliable dashboard. Not ten. One. Focused on the business questions from step one, built on the definitions from step two. Make it the first thing that loads in your leadership meetings. Reference it constantly. When people see the same numbers in the same place every week, data stops being an event and starts being an environment.
Weeks 9–12: Train your first self-serve cohort. Identify 3–5 business users who ask the most frequent data questions. Train them to explore the governed dataset independently. Measure how many ad hoc requests this removes from the analyst’s queue. Use that as your ROI case for further investment. If you can show leadership that self-serve saved your team 15 hours per week, the conversation about expanding the data function becomes much easier.
Ongoing: Invest in translators. Your most important data hire — or your most important development investment in an existing team member — isn’t the person with the deepest technical skill. It’s the person who can sit between the business and the data and make each side legible to the other. Technical skills are trainable. The judgment to know which question to ask, which metric matters, and how to present a finding so it actually changes behaviour — that’s the rare skill. That’s what separates a data team that generates reports from a data team that drives decisions.
The Real Shift
Becoming data-driven isn’t a technology project. It’s an organisational behaviour change — and like all behaviour change, it’s slow, uncomfortable, and requires more patience than most companies budget for.
The organisations that get this right don’t just invest in better data infrastructure. They invest in better data thinking building environments where evidence is valued over eloquence, where curiosity is rewarded rather than punished, and where the analyst’s role is understood as strategic, not administrative.
I’ve spent my career building exactly this kind of environment — turning fragmented data landscapes into coherent analytical systems, translating business ambiguity into measurable frameworks, and training the next generation of African data professionals to do the same.
The data doesn’t change decisions. The analyst who translates it does.
That’s the work. And it’s where the real value lives.
Ayomide Olaniyan is a Lead Data Analyst specialising in analytics, growth,customer retention, and cross-subsidiary data strategy